National freight and logistics in the U.S. and what shippers should know in 2026
a[data-rs-seo-link]{text-decoration:underline!important;color:#1a56db!important;cursor:pointer!important;}a[data-rs-seo-link]{text-decoration:underline!important;color:#1a56db!important;cursor:pointer!important;}
What national freight and logistics covers
National freight and logistics is not one transport mode or one carrier market. It is the coordinated movement of goods across highways, railroads, ports, inland waterways, airports, pipelines, terminals and warehouses. For shippers, the practical issue is clear: freight performance depends on how well the network connects, not only on the quoted price for one truckload, container or air shipment. According to the Bureau of Transportation Statistics, the U.S. freight system handled about 20.0 billion tons of goods worth about $25.0 trillion in 2024, or roughly 54.8 million tons and $68.4 billion per day. At that scale, Freight and Logistics planning becomes a national supply chain issue, especially for importers, exporters and companies distributing goods across several regions.
It helps to separate movement from management. Movement is the physical transport of goods. Management covers mode selection, routing, booking, compliance, customs coordination, cargo visibility, inventory positioning, delivery appointments, claims handling and contingency planning. When these functions are aligned, a shipment can move from an overseas supplier to a port, through a rail ramp or drayage provider, into a warehouse and onward to a customer with fewer delays and fewer handoff problems.
The data picture for 2026 planning
Two types of public data shape the current national freight planning discussion. The first is annual freight activity data, including the Transportation Statistics Annual Report 2025 from the Bureau of Transportation Statistics, which summarizes 2024 freight flows by mode, commodity and trade category. The second is the Freight Analysis Framework, the main public dataset used to estimate freight flows by origin, destination, commodity and mode.
In July 2026, the Bureau of Transportation Statistics released FAF6, a new benchmark version based on 2022 commodity flow data. That release matters because a benchmark change can affect comparisons with older estimates. FAF5.7.1 remains important for 2017 to 2024 annual estimates and longer-range forecasts, while FAF6 provides the newer benchmark structure for 2022. For business users, the practical lesson is to check the dataset version before comparing freight volumes over time. A shift in mode share may reflect real market movement, a methodology change or both.
The national data show that the U.S. freight system remains heavily road-centered, but not truck-only. Bulk commodities, energy products, parcels, international containers, rail intermodal, air cargo and pipeline movements each serve different parts of the network. A resilient freight plan should therefore ask which mode fits each commodity, lane, lead time and risk profile.
Freight mode mix shows why multimodal planning matters
BTS and FHWA 2025 data for 2024 show a freight market in which trucks carry the largest share of both tonnage and value, while pipelines, rail, water, air and multimodal services handle specialized parts of the system. The figures below are rounded from national mode tables and should be read as system-level context, not as carrier pricing data.
| Mode | 2024 tons | 2024 value | What it tells shippers |
|---|---|---|---|
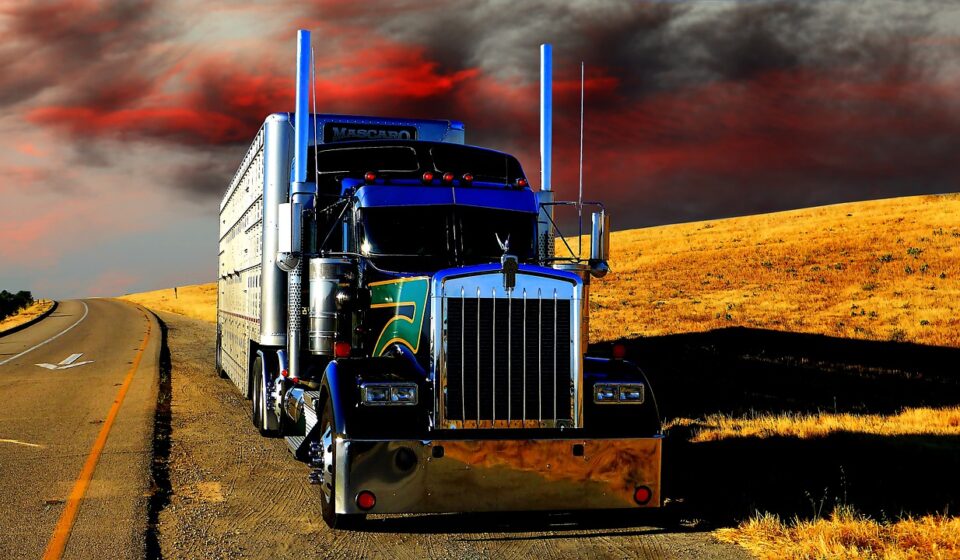
| Truck | 12.844 billion tons | $18.079 trillion | Dominates domestic distribution, regional freight, retail replenishment and first- or final-mile access. |
| Pipeline | 4.025 billion tons | $1.527 trillion | Essential for energy and liquids, but not a substitute for general merchandise logistics. |
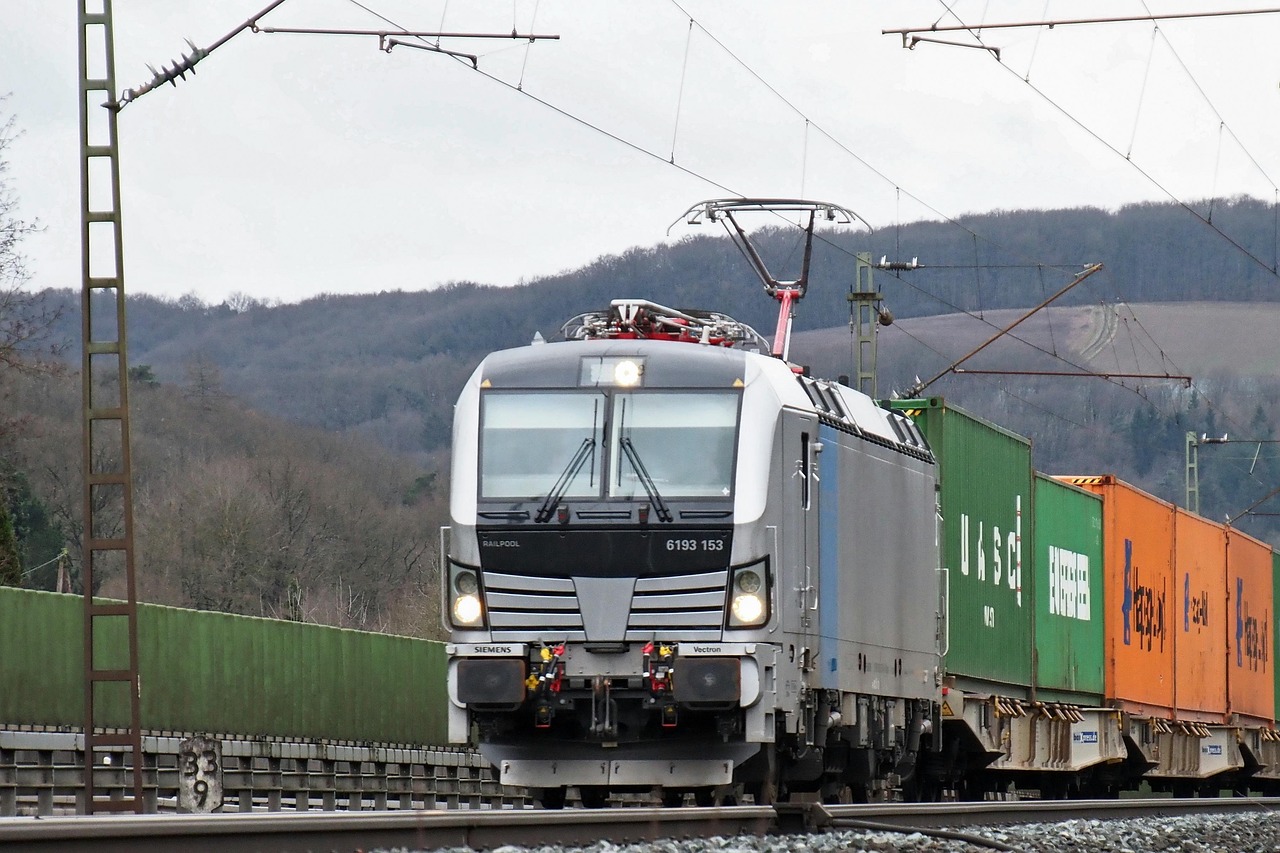
| Rail | 1.533 billion tons | $752 billion | Important for long-distance bulk, intermodal corridors and heavy commodities. |
| Water | 772 million tons | $363 billion | Best suited to bulk, heavy and port-linked cargo where transit time is less critical. |
| Multiple modes and mail | 634 million tons | $3.333 trillion | Reflects parcel, intermodal and shipments where the shipper may not know every mode used. |
| Air, air and truck | 7 million tons | $809 billion | Small by weight but significant by value because it supports time-sensitive and high-value cargo. |
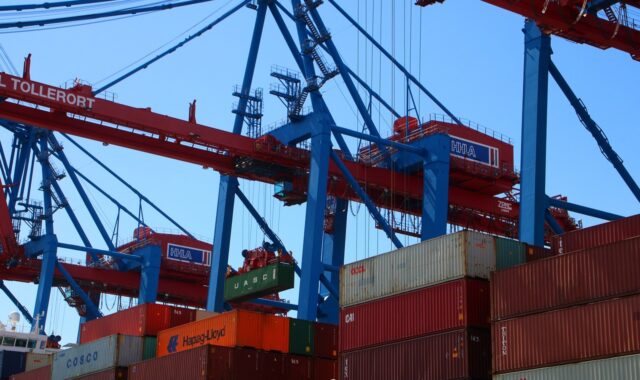
The table also explains a common misunderstanding. Trucking is the most visible part of national freight and logistics because nearly every supply chain touches a road at some point. However, national performance also depends on ports, rail ramps, yards, inland waterways, pipeline networks, sorting hubs and warehouse capacity. A delay at a rail terminal, a port gate, a bridge, a mountain pass or an urban distribution zone can affect the truck move even when the truck is available.
The same data show why value and weight should be analyzed separately. Air freight is small by tonnage but important by value because it carries products where speed, security or inventory cost can justify the premium. Pipeline freight is large by tonnage because energy products are heavy and move continuously. Rail and water can be efficient for bulk or long-distance flows, but they usually need truck connections at one or both ends. Shippers that compare modes only by headline rate can miss these structural differences.
Domestic freight still drives the network that imports and exports use
International trade attracts much of the attention in logistics discussions, but domestic movement makes up most measured U.S. freight activity. BTS tables for 2024 show domestic freight at about 88.7% of total tons and 79.4% of value. Imports accounted for about 4.9% of tons and 12.3% of value, while exports accounted for about 6.3% of tons and 8.2% of value. The import share is higher by value than by weight because many imported goods are manufactured, high-value or consumer-facing products.
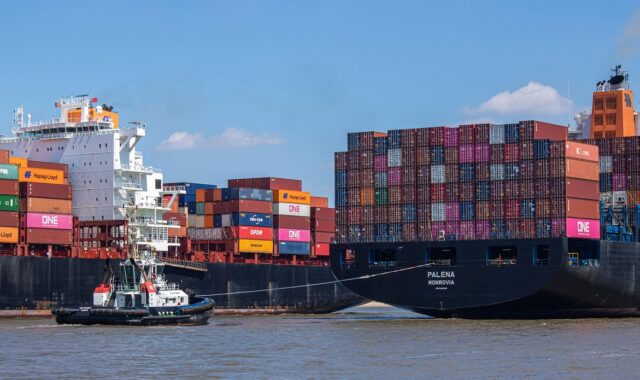
This does not make international logistics less important. It means imports and exports are tightly connected to the domestic freight system. A container arriving at a port still needs drayage, chassis availability, customs clearance, rail or truck linehaul, warehouse receiving and inland distribution. Export freight depends on the same network in reverse, with added pressure from vessel cutoffs, documentation deadlines and equipment availability. Even when the ocean move covers the longest distance, domestic nodes often determine whether the cargo reaches the buyer on time.
There is also a measurement limitation. Public tables may not fully capture how imported inputs are transformed, reshipped or combined with domestic goods before final delivery. Imported components, for example, may move from a port to a factory, become part of a finished product and then move again through the domestic network. That is why trade teams and domestic transportation teams should share lane data, product priorities and inventory assumptions instead of planning in separate silos.
What the 2026 federal plan signals
On May 18, 2026, the U.S. Department of Transportation released the 2026 National Freight Strategic Plan. The plan describes the freight system as a nearly seven-million-mile multimodal network and organizes federal freight priorities around six goals:
- Safety, including reduced serious injuries and fatalities in freight operations.
- Efficiency, including reliability improvements and attention to nationally significant bottlenecks.
- Security, including cargo theft, fraud, cybersecurity and national defense mobility.
- Resiliency, including risk reduction, redundancy and response planning.
- Innovation, including data, digital standards and advanced freight technologies.
- Workforce capability, including entry pathways, upskilling, working conditions and workforce data.
For shippers, this plan should not be treated as a short-term rate forecast. It is better read as a signal of where public agencies are likely to focus planning, grants, analysis and coordination. Bottlenecks, security risks, multimodal connections, data visibility and workforce constraints are no longer back-office issues. They are part of national freight strategy because they affect supply chain reliability across industries.
The 2026 plan also discusses the National Multimodal Freight Network. The January 2025 draft network described in the plan included about 78,000 roadway miles, 80,000 rail miles, 21,000 miles of waterways and shipping channels, 140 ports and 65 airports. The business implication is that freight infrastructure planning is increasingly corridor-based and node-based. A shipper should evaluate not only the origin and destination, but also the gateway, terminal, bridge, interchange, rail ramp, port, border crossing and warehouse cluster that make the lane work. See also: Customs and Compliance.
Practical planning implications for shippers
Map freight by service need, not only by lane
A national freight plan should start with product requirements. High-value electronics, pharmaceuticals, urgent spare parts and seasonal retail goods may need faster service, tighter milestones and more visibility. Bulk commodities, construction materials, agricultural products and some energy-related freight may put more weight on cost per ton, equipment suitability and network access. The right mode depends on the shipment’s value density, time sensitivity, handling risk, inventory strategy and distance.
Build options at the nodes
Many delays occur where modes meet. Ports, rail ramps, warehouses, yards and urban delivery zones are often more important than the linehaul segment alone. Shippers can reduce risk by qualifying alternate gateways, maintaining drayage options, using appointment discipline, validating warehouse receiving capacity and documenting escalation paths before disruptions occur. The goal is not to build expensive redundancy everywhere. It is to identify the few nodes where failure would stop the entire flow.
Treat visibility as capacity risk management
Visibility is often described as a technology feature, but in national freight and logistics it is also a capacity tool. Better estimated arrival times, exception alerts, container status, purchase order visibility and inventory handoff data help teams decide whether to expedite, reroute, hold, split or consolidate freight. Visibility does not eliminate congestion, but it can reduce late decisions and unnecessary premium transportation.
Compare rates with total landed cost
The lowest linehaul rate may not be the lowest total cost if it creates demurrage, detention, missed sales, chargebacks, extra storage or unplanned expedited freight. A more useful comparison includes freight rate, accessorials, inventory carrying cost, delivery reliability, claims risk, carbon or compliance requirements and the administrative cost of managing exceptions. National freight performance is measured in delivered outcomes, not only in cents per mile or dollars per container.
What to monitor next
Shippers and trade teams should monitor several developments through 2026 and beyond. First, watch how FAF6 documentation and future FAF releases update the national data baseline. Second, follow federal and state freight planning because corridor and gateway priorities can shape infrastructure investment. Third, track cargo security and fraud controls, especially for high-value and easily diverted goods. Fourth, evaluate labor and workforce constraints at warehouses, terminals and trucking providers, not only at ports. Finally, monitor technology standards, because freight data is most useful when it can move across trading partners without manual rework.
The main conclusion is that national freight and logistics is becoming more data-driven, more security-conscious and more multimodal. Trucking remains central, but trucking works best when ports, railroads, warehouses, highways, digital systems and public infrastructure planning are aligned. Shippers that understand the full network can make better decisions about mode choice, inventory placement, trade lanes and disruption response.
Frequently asked questions
What is the difference between freight and logistics?
Freight is the cargo movement itself. Logistics is the broader planning and control process that makes the movement useful, including booking, routing, storage, customs coordination, visibility, documentation, delivery timing and exception management.
Which freight mode is most important in the United States?
Trucking carries the largest share of U.S. freight by both tonnage and value, based on 2024 national data. However, rail, pipeline, water, air and multimodal services are essential for specific commodities, distances, gateways and service requirements.
How does national freight planning affect importers and exporters?
Importers and exporters depend on domestic freight networks after cargo enters the country or before it leaves. Port access, drayage, rail capacity, warehouse receiving, border crossings and final-mile delivery can determine whether an international shipment meets its commercial deadline.
What data should shippers use for national freight planning?
Public sources such as BTS freight tables, the Freight Analysis Framework, state freight plans and federal freight strategy documents are useful for understanding network structure and trends. Company shipment data is still needed for lane-level decisions, carrier procurement and service design.